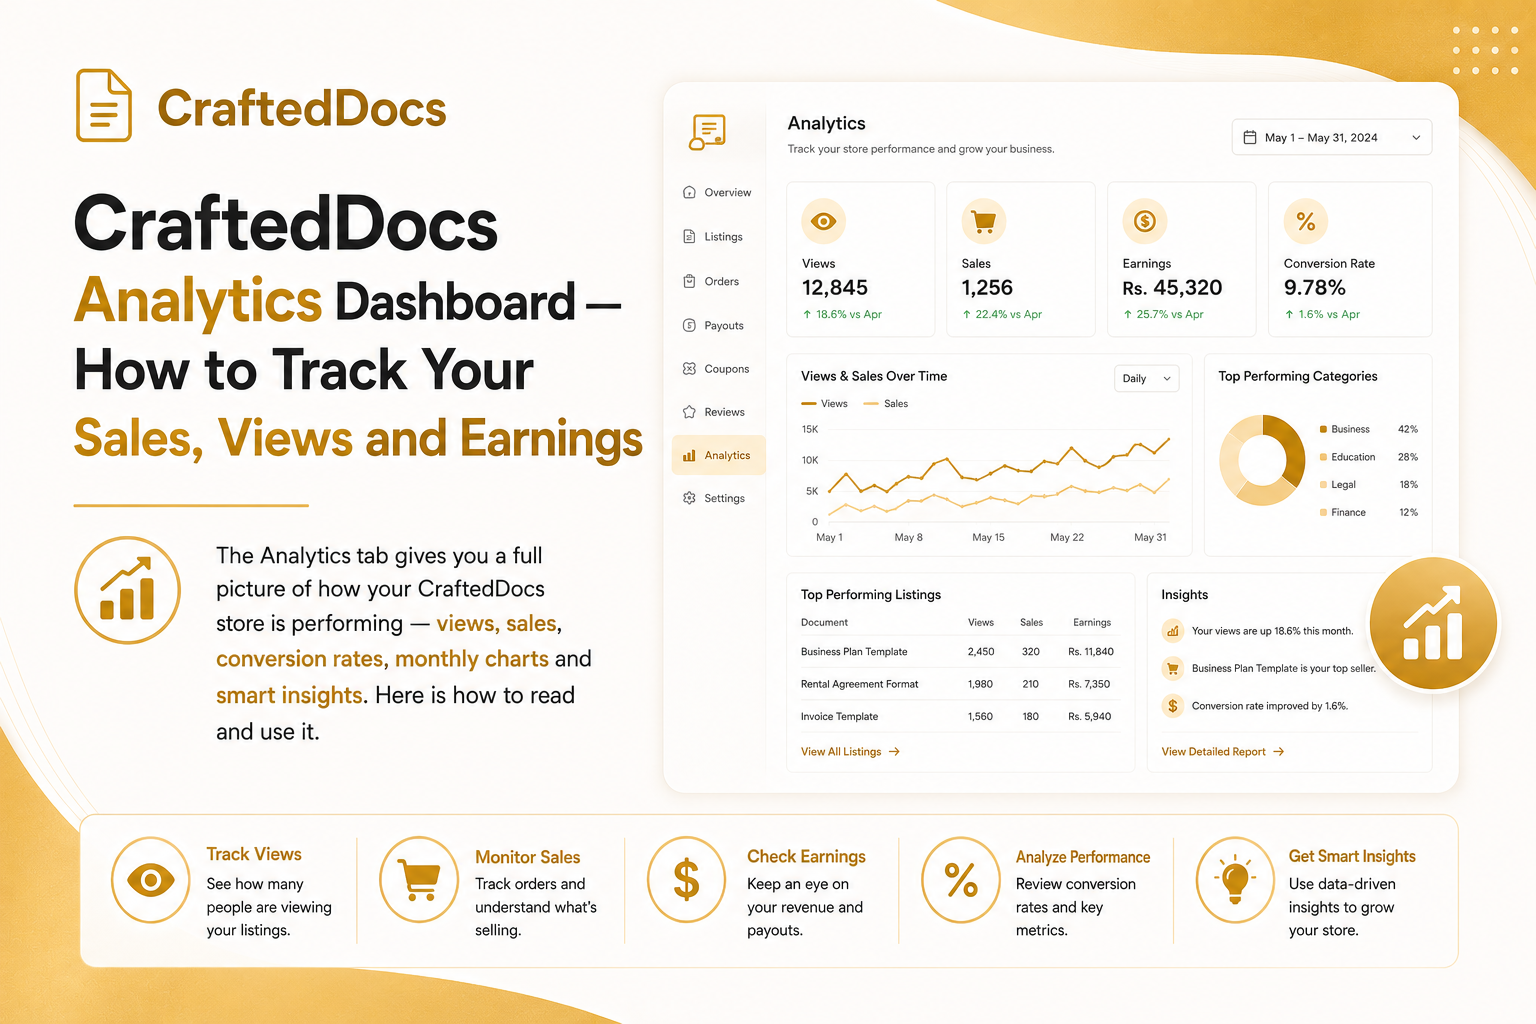
What is the Analytics Tab?
The Analytics tab on your CraftedDocs seller dashboard gives you real data about every listing you have — how many people are viewing it, how many are buying, how much you are earning and how you are trending over time.
To access it: Dashboard → Analytics in the left sidebar.
The 5 KPI Cards at the Top
When you open the Analytics tab, you will see five key performance indicator cards:
- This Month Earnings — your seller share earned this calendar month, with a percentage showing growth or decline vs last month (green arrow = up, red arrow = down)
- Total Views — total number of times any of your product pages has been visited by anyone
- Total Sales — total number of completed purchases across all your listings
- Conversion Rate — the percentage of views that resulted in a sale. For example: 500 views and 10 sales = 2% conversion rate
- Active Listings — number of your listings currently approved or featured on the marketplace
Reading the 30-Day Sales Chart
Below the KPI cards you will see a bar chart showing your sales revenue for each of the last 30 days. Each bar represents one day — the taller the bar, the more you earned that day. Hover over any bar to see the exact date, number of sales and total revenue.
Today is highlighted in amber. Use this chart to spot patterns:
- Do you sell more on weekdays or weekends?
- Did a WhatsApp share spike your sales on a particular day?
- Are sales growing week over week?
Best Performing Listing Card
This card shows your single best-performing listing by total earnings. It displays:
- Listing title and direct link
- Total earned from this listing
- Number of sales
- Total views
- Conversion rate for this specific listing
Use this as inspiration — whatever makes your top listing successful, replicate it in new listings.
Category Breakdown
The category breakdown section shows a horizontal bar chart of your sales by category (Notes, Templates, Spreadsheets etc.). This tells you which subjects your buyers prefer and where you should focus your next uploads.
Per-Listing Performance Table
At the bottom of the Analytics tab is a full table showing every active listing with:
- Views and sales count
- Conversion rate — colour coded (green = 5%+ great, amber = 2-5% average, grey = below 2% needs work)
- Total earnings from this listing
- Current status (Approved / Featured)
Sort through this table to find your worst-performing listings — low conversion rates despite decent views usually means the listing needs a better preview, description or cover image.
Smart Insights Panel
At the bottom of the page, CraftedDocs automatically generates personalised insights based on your data:
- If your conversion rate is below 1% and you have decent views — you will get a tip to improve preview files and thumbnails
- If you have zero views — you will be prompted to share your seller profile link
- If earnings dropped vs last month — you will be encouraged to add new listings
- If earnings grew — positive reinforcement to keep going
How to Use Analytics to Grow Your Income
Here is a practical weekly routine for using your analytics:
- Check the KPI cards every Monday — is this month ahead or behind last month?
- Look at the 30-day chart — identify your best day and think about why
- Find your lowest conversion rate listing and improve it (better cover image, add preview, improve description)
- Look at category breakdown — upload one more listing in your best-selling category
Analytics are only available for sellers. Create your free seller account here.